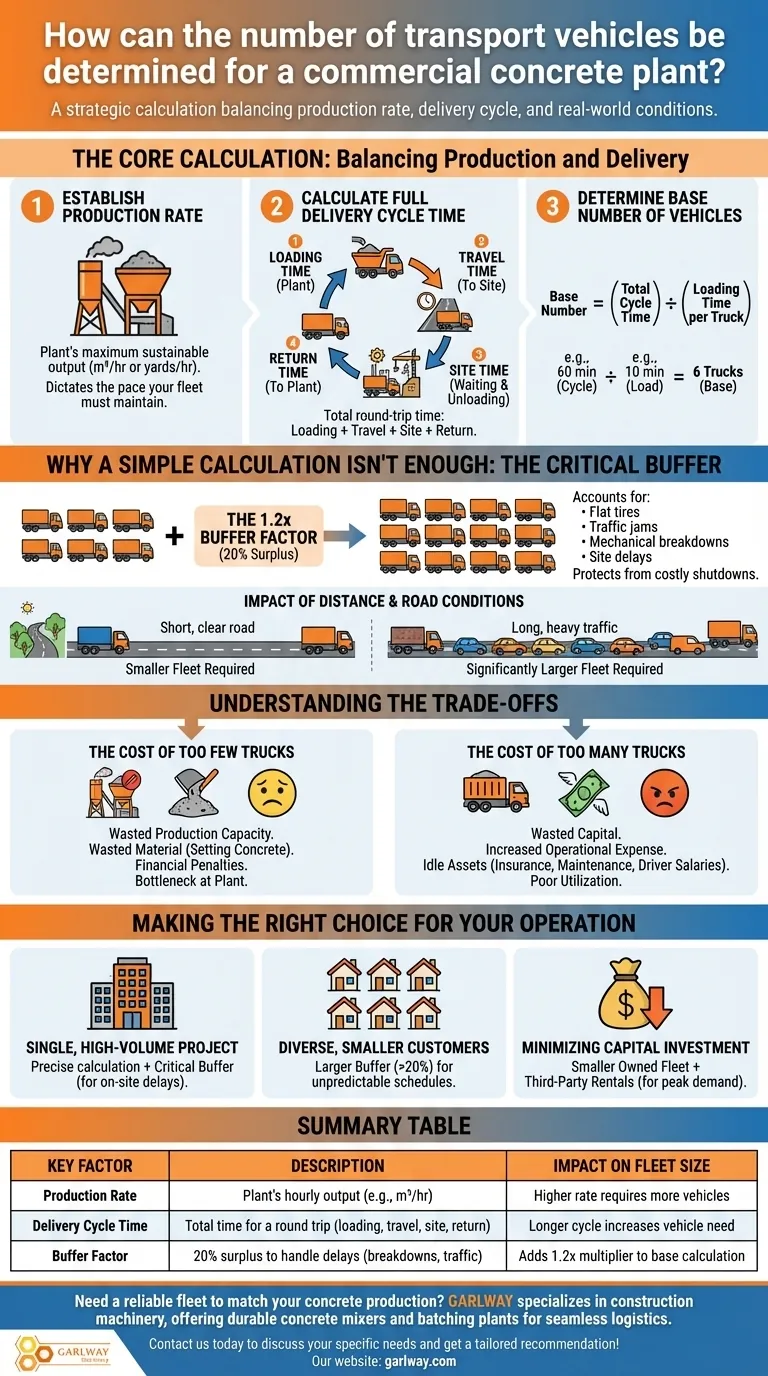
The number of transport vehicles for a commercial concrete plant is determined by a core calculation balancing the plant's production rate against the total time it takes for a truck to complete a full delivery cycle. Key variables include the plant's hourly output, the travel distance to the job site, and anticipated road and site conditions. As a crucial rule of thumb, you should plan to have a surplus of vehicles, typically 1.2 times the number required by your base calculation, to account for real-world delays.
The optimal fleet size is not just about meeting production capacity; it's a strategic calculation that balances logistics, accounts for inevitable delays, and protects your operation from costly shutdowns.
The Core Calculation: Balancing Production and Delivery
To determine your base vehicle requirement, you must first understand the relationship between how fast you make concrete and how fast you can deliver it.
Step 1: Establish Your Production Rate
The entire calculation begins with your plant's maximum sustainable output. This is measured in cubic meters (or yards) per hour.
This figure dictates the pace your transport fleet must maintain. If the plant can produce 100 cubic meters per hour, your trucks must be able to haul that amount away every hour to prevent a costly shutdown.
Step 2: Calculate the Full Delivery Cycle Time
The delivery cycle time is the total time a single truck takes to complete one round trip. This is the most critical variable and must be calculated carefully.
It includes four distinct phases:
- Loading Time: Time spent at the plant being filled with concrete.
- Travel Time: The total time to drive from the plant to the job site and return. This must account for typical traffic and road conditions.
- Site Time: Time spent at the job site, including waiting to unload and the actual unloading process. This can be highly variable.
- Return Time: The time it takes to travel back to the plant.
Step 3: Determine the Base Number of Vehicles
With these two figures, you can calculate your theoretical minimum fleet size. Divide the total cycle time by the time it takes to load one truck.
For example, if a full cycle takes 60 minutes and loading one truck takes 10 minutes, you would need a base of 6 trucks (60 / 10 = 6) to ensure a truck is always ready to be loaded the moment the previous one is full.
Why a Simple Calculation Isn't Enough
The base calculation provides a starting point, but real-world operations are never perfect. Your final number must include a buffer to absorb unforeseen issues.
The Critical "Buffer Factor"
This is where the recommendation to prepare 1.2 times the number of needed vehicles comes into play. This 20% buffer is not arbitrary; it's a safety margin.
This buffer accounts for flat tires, unexpected traffic jams, mechanical breakdowns, or delays at the job site. Without it, a single delayed truck can halt your entire production line.
The Impact of Distance and Road Conditions
The "travel time" component of your cycle is rarely constant. A project located across town during rush hour will require a significantly larger fleet than a project next door on a clear road.
You must evaluate each major route and adjust your fleet allocation accordingly. A one-size-fits-all number will not work for a plant serving a diverse geographic area.
Understanding the Trade-offs
Optimizing your fleet size is a critical business decision with direct financial consequences. Both over- and under-estimating have significant costs.
The Cost of Too Few Trucks
Having an insufficient fleet is the most immediate operational risk. It creates a bottleneck at the plant.
This leads directly to wasted production capacity, as you must stop mixing concrete. Even worse, it can lead to wasted material, as the concrete in waiting trucks may begin to set, and can result in financial penalties for failing to meet delivery schedules.
The Cost of Too Many Trucks
An oversized fleet, on the other hand, represents wasted capital and increased operational expense.
Each idle truck is a non-performing asset. This means unnecessary costs for insurance, maintenance, and driver salaries. The goal is maximum utilization, not simply maximum fleet size.
Making the Right Choice for Your Operation
Use the core calculation as your foundation and the buffer factor as your safety net. Tailor your final decision to your specific business model and risk tolerance.
- If your primary focus is a single, high-volume project: You can calculate your needs more precisely, but a buffer is still critical to protect against on-site delays that are outside your control.
- If your primary focus is serving many smaller, diverse customers: A larger buffer (potentially more than 20%) is necessary to manage unpredictable schedules and highly variable travel times.
- If your primary focus is minimizing initial capital investment: Consider a smaller owned fleet supplemented by trusted third-party rentals to handle peak demand, but be aware this may increase your per-delivery cost and operational complexity.
Approaching this as a strategic analysis rather than a simple math problem is the key to an efficient and profitable operation.
Summary Table:
| Key Factor | Description | Impact on Fleet Size |
|---|---|---|
| Production Rate | Plant's hourly output (e.g., m³/hr) | Higher rate requires more vehicles |
| Delivery Cycle Time | Total time for a round trip (loading, travel, site, return) | Longer cycle increases vehicle need |
| Buffer Factor | 20% surplus to handle delays (breakdowns, traffic) | Adds 1.2x multiplier to base calculation |
Need a reliable fleet to match your concrete production? GARLWAY specializes in construction machinery, offering durable concrete mixers and batching plants for construction companies and contractors globally. Our solutions ensure seamless logistics and maximum productivity. Contact us today to discuss your specific needs and get a tailored recommendation!
Visual Guide
Related Products
- HZS180 Ready Mix Concrete Plant for Foundations with Sand and Cement
- HZS35 Small Cement Concrete Mixing Batch Plant
- HZS75 Concrete Batching Plant Cement Mixer Price Concrete Mixer Bunnings Mixing Plant
- Commercial Electric Concrete Mixer Machine HZS 50 Small Batch Plant for Sale
- HZS120 Ready Mix Concrete Batching Plant Commercial Mud Cement Mixer
People Also Ask
- What is the core component of a concrete batching plant? The Mixer Unit Defines Your Concrete Quality
- What systems are included in a ready-mix concrete plant? A Guide to the 6 Core Systems
- What are the components of a ready mix concrete plant? A Guide to Precision and Efficiency
- What is the name of the machine used in ready mix? Unpacking the Complete Concrete System
- Why is RMC plant important? The Key to Speed, Quality, and Efficiency in Modern Construction