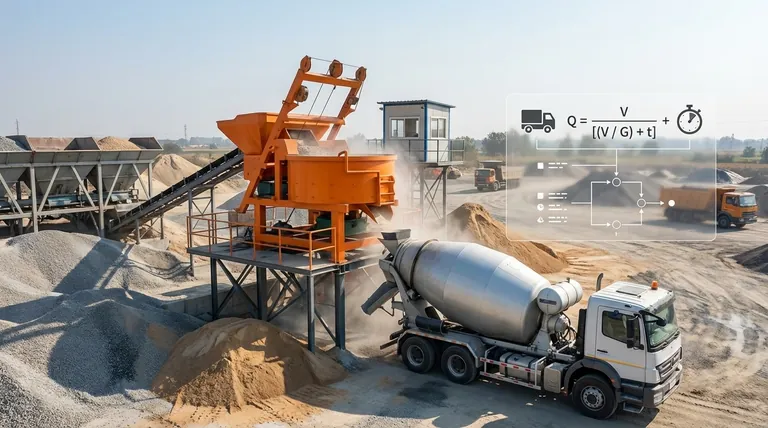
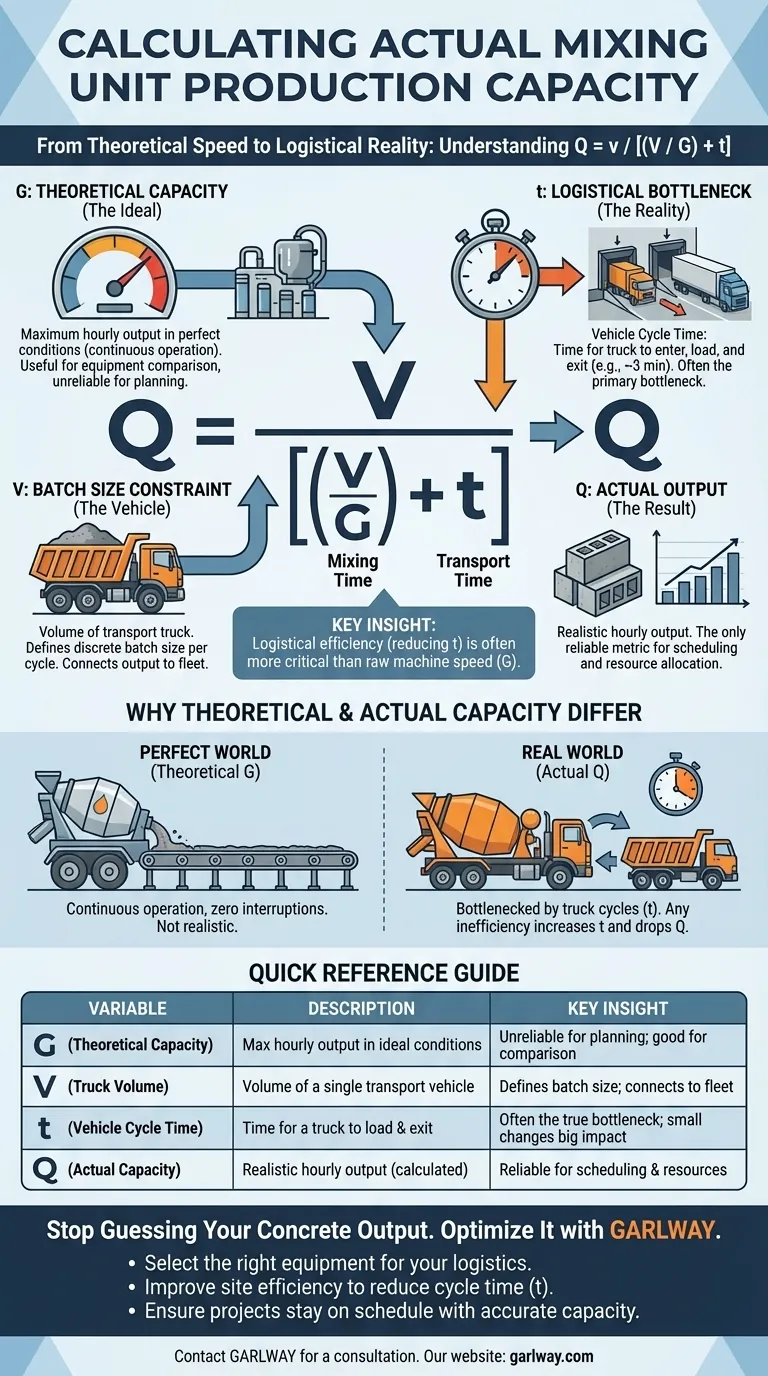
The actual production capacity of a mixing unit is calculated using a formula that tempers the machine's theoretical maximum with the practical realities of logistics. The core calculation is Q = V / [(V / G) + t], where Q is the actual capacity, V is the mixing truck's volume, G is the theoretical capacity, and t is the vehicle cycle time.
A mixing unit's real-world output is not determined by its theoretical speed, but by the primary bottleneck in the process: the time it takes to cycle transport vehicles. This formula shifts the focus from machine specifications to logistical efficiency.
Deconstructing the Capacity Formula
To accurately forecast production, you must understand what each variable in the formula represents and why it matters. This isn't just a mathematical exercise; it's a model of your operational reality.
G - The Theoretical Maximum (The Ideal)
The theoretical capacity (G) is the "sticker price" of your mixing unit. It's the maximum volume the machine could produce in an hour if it ran continuously without any interruptions.
This figure is useful for equipment comparison but is an unreliable metric for day-to-day planning because it exists in a perfect vacuum, free of real-world delays.
V - The Batch Size Constraint (The Vehicle)
The volume of your transport truck (V) defines the discrete batch size for each production cycle. Your plant cannot produce continuously; it must produce in chunks equal to the capacity of the vehicle being loaded.
This variable connects the plant's output directly to the fleet that serves it. A larger truck volume means fewer cycles are needed to move the same amount of material.
t - The Logistical Bottleneck (The Reality)
This is the most critical variable for understanding actual capacity. t represents the time required for a transport vehicle to enter the station, get into position, be loaded, and then exit.
This "vehicle cycle time" is non-productive time for the mixer. While a truck is maneuvering, the plant is idle. A typical value for t is around 3 minutes, but this can vary significantly based on site layout and driver efficiency.
Q - The Actual Output (The Result)
The actual production capacity (Q) is the final, realistic output you can expect. The formula calculates this by determining the total time for one full cycle (mixing time V/G + transport time t) and then figuring out how many such cycles can happen in an hour.
Why Theoretical and Actual Capacity Differ
The gap between the manufacturer's stated capacity and your daily output is not due to a faulty machine. It is the natural result of the entire operational process.
The Machine vs. The Process
Your mixer might be capable of producing material at a very high rate (G), but it is just one component in a larger process. The overall process speed is always dictated by its slowest part.
Identifying the True Bottleneck
The formula Q = V / [(V / G) + t] mathematically proves that the vehicle cycle time (t) is often the true bottleneck. Even if your mixer is incredibly fast, its output is constrained by how quickly you can get one truck out and the next one in.
The Impact of Inefficiency
Any inefficiency in your yard—such as poor traffic flow, slow gate operation, or unclear instructions for drivers—directly increases t. A small increase in this cycle time can cause a significant drop in your actual daily capacity (Q).
Understanding the Trade-offs
Using this formula provides clarity, but it's essential to recognize its limitations and the risks of ignoring its insights.
The Limitation of the Formula
This calculation provides a powerful baseline but assumes a steady state. It does not account for other real-world disruptions like material shortages, unexpected maintenance, or quality control holds. It models the logistical bottleneck, not all potential operational failures.
The Risk of Planning with 'G'
Basing project timelines, resource allocation, or cost estimates on the theoretical capacity (G) is a common and costly mistake. It inevitably leads to missed deadlines and budget overruns because it ignores the unavoidable logistical friction represented by t.
Optimizing the Wrong Variable
Without this understanding, managers may invest heavily in upgrading a mixer to increase G, only to see no improvement in actual output. If the vehicle cycle time t remains the bottleneck, any gains in mixing speed are wasted while the plant waits for the next truck.
How to Apply This to Your Operation
Use this calculation not just as a formula, but as a diagnostic tool to guide your decisions.
- If your primary focus is accurate project planning: Use the calculated
Qto set realistic daily output targets, schedule material deliveries, and manage client expectations. - If your primary focus is improving plant efficiency: Concentrate on initiatives that reduce
t. This could involve optimizing site traffic patterns, training drivers, or implementing better signaling systems for vehicle positioning. - If your primary focus is evaluating new equipment: Run the numbers to see how a new mixer's higher
Gwill actually translate intoQgiven your existing logistical constraints (Vandt).
By shifting your focus from theoretical speed to logistical reality, you can accurately predict and optimize your true production capacity.
Summary Table:
| Variable | Description | Key Insight |
|---|---|---|
| G (Theoretical Capacity) | Maximum hourly output in ideal conditions. | Useful for equipment comparison, but unreliable for planning. |
| V (Truck Volume) | The volume of a single transport vehicle. | Defines the batch size for each production cycle. |
| t (Vehicle Cycle Time) | Time for a truck to load and exit (e.g., ~3 min). | Often the true bottleneck; small increases cause big output drops. |
| Q (Actual Capacity) | Realistic hourly output (Q = V / [(V / G) + t]). | The only reliable metric for scheduling and resource allocation. |
Stop Guessing Your Concrete Output. Optimize It with GARLWAY.
Are project delays and budget overruns due to inaccurate capacity planning hurting your business? You need a partner who understands that true production power comes from the synergy between reliable machinery and efficient logistics.
GARLWAY specializes in providing construction companies and contractors with durable, high-performance concrete mixers and batching plants designed for real-world sites. We don't just sell equipment; we provide solutions that help you maximize your actual output (Q).
Let us help you:
- Select the right mixer or batching plant based on your specific logistical constraints.
- Improve your site's efficiency to reduce vehicle cycle time (
t) and boost daily production. - Ensure your projects stay on schedule and within budget with accurate capacity forecasting.
Contact GARLWAY today for a consultation and discover how our machinery can become the reliable backbone of your efficient operation.
Visual Guide
Related Products
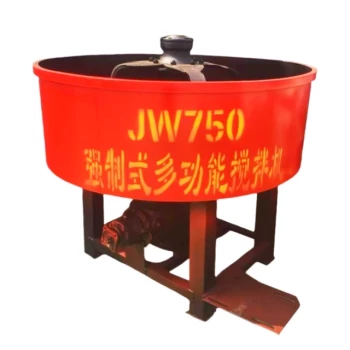
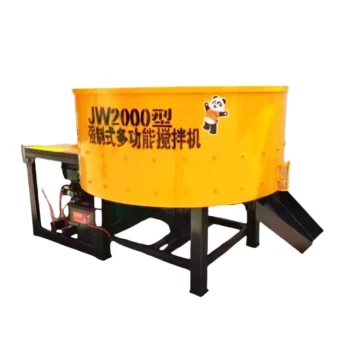
- Hydraulic Concrete Mixer Machine Cement Mixing Equipment for Mixture Concrete
- Portable Concrete Mixer Machine Equipment for Mixing Concrete
- Construction Products Concrete Plant Machine Mixing Concrete Mixer
- Portable Ready Mix Concrete Mixer Equipment
- Commercial Electric Concrete Mixer Machine HZS 50 Small Batch Plant for Sale
People Also Ask
- What are the main types of concrete mixers? A Guide to Batch, Continuous & More
- What is the life expectancy of a concrete mixer? Maximize Your Mixer's Lifespan & ROI
- Why is it important to read and understand the operation manual of a concrete mixer? Ensure Safety, Quality & Efficiency
- What are the main types of concrete mixers mentioned? Find the Perfect Mixer for Your Project
- What are hydraulic concrete mixers used for? Powering Large-Scale Construction Projects